How Kubernetes Assigns GPUs: Tracing the Device Plugin Path from Pod Spec to CUDA
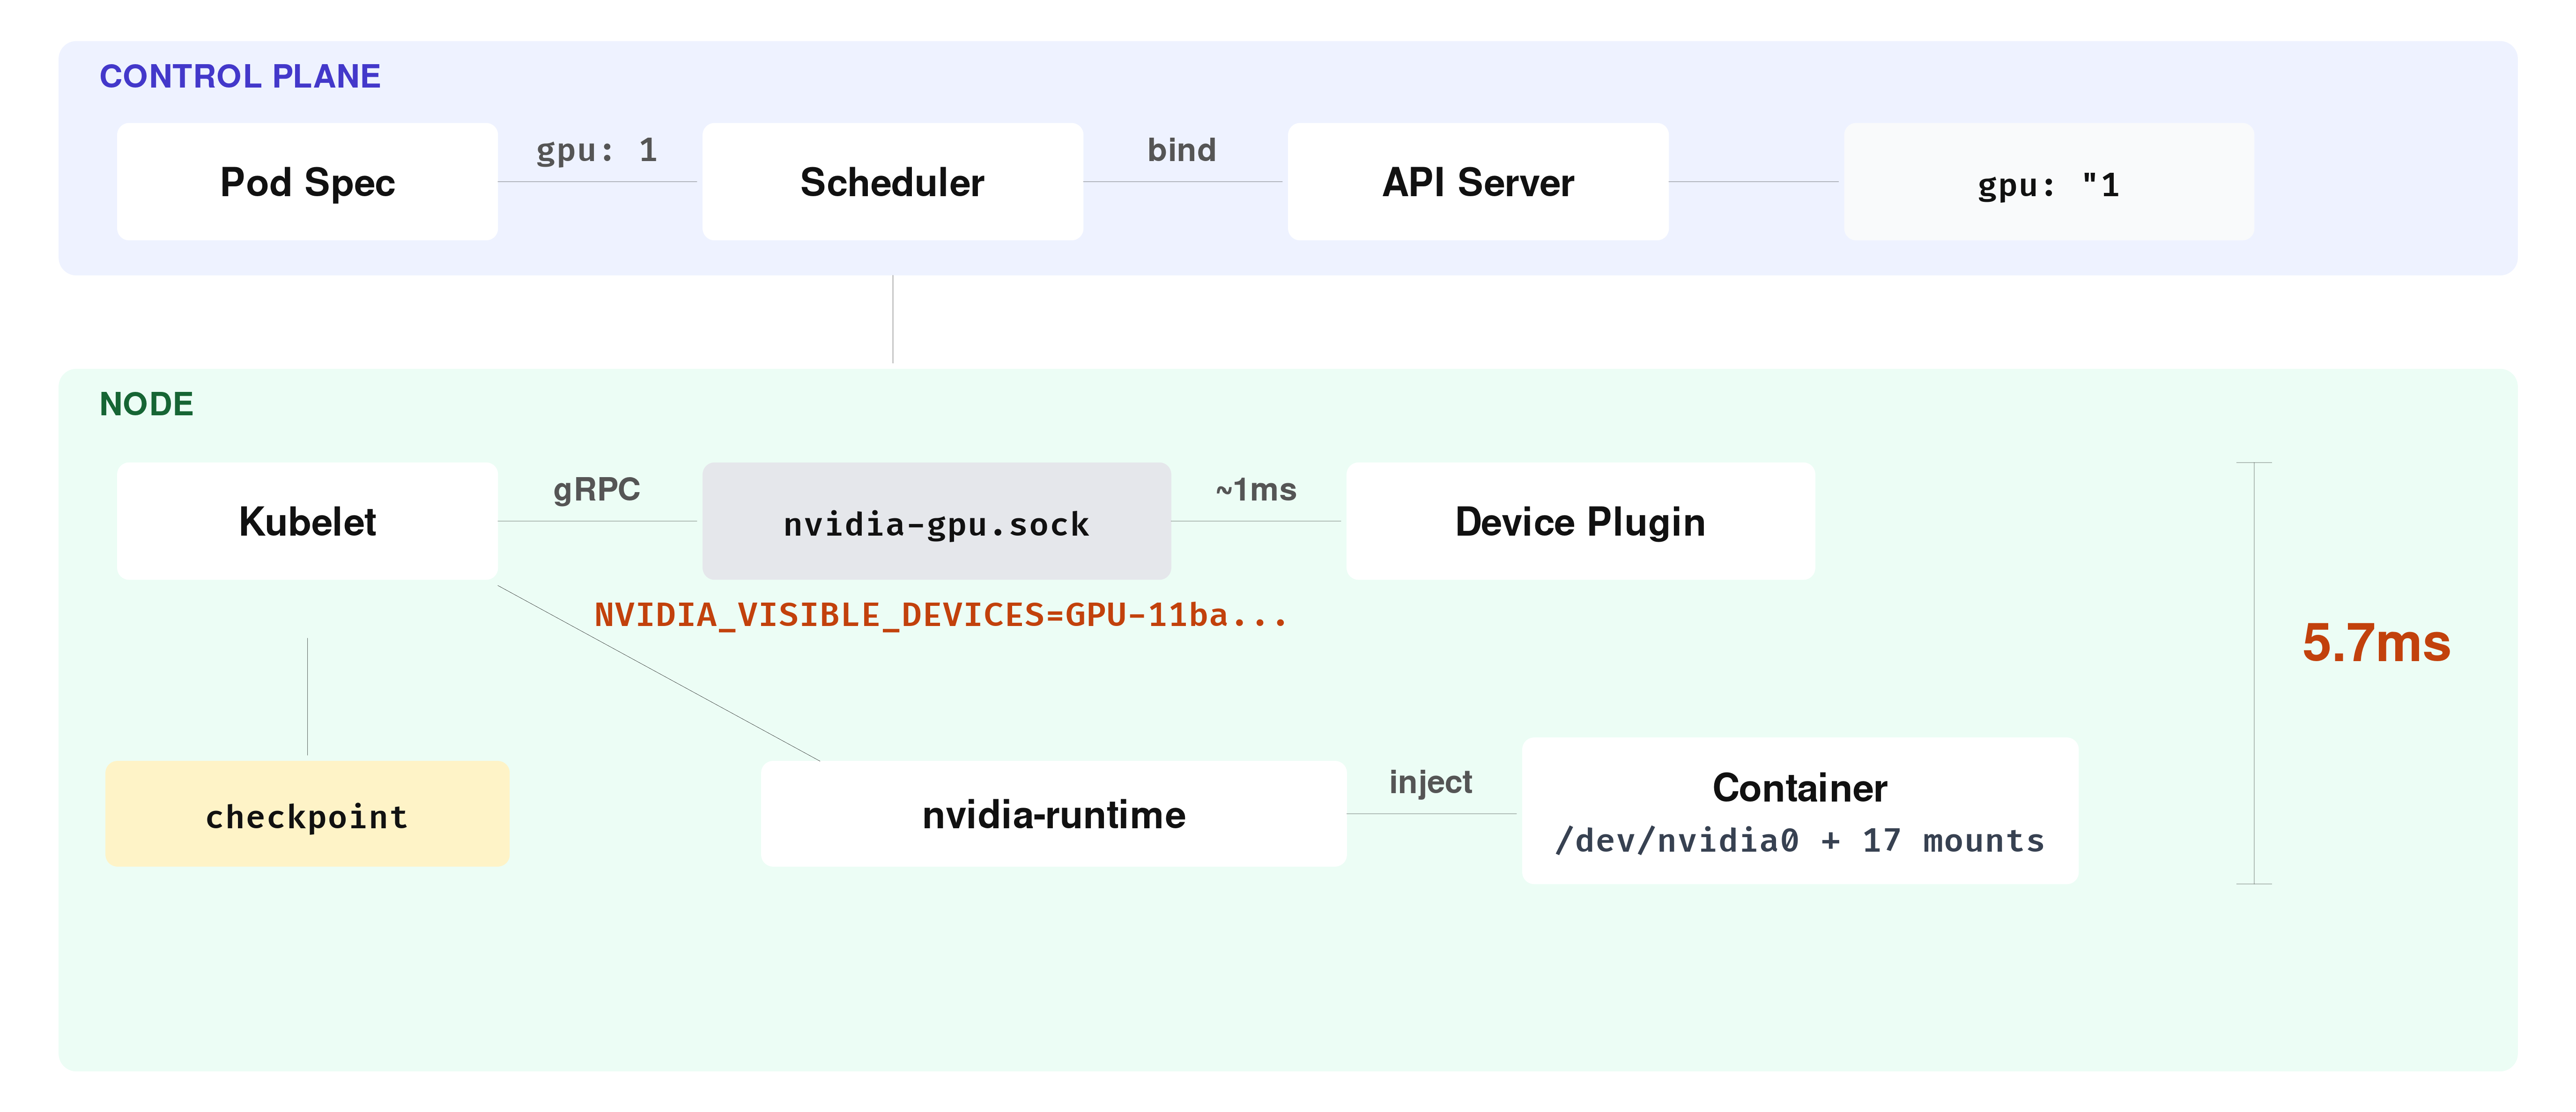
TL;DR When you request nvidia.com/gpu: 1 in a pod spec, the scheduler places the pod on a node that reports a GPU as available. From that point on, kubelet and the NVIDIA device plugin handle the actual device allocation over a Unix socket on the node. The plugin picks a GPU, kubelet writes the assignment to a local checkpoint file, and the NVIDIA container runtime injects the device nodes and driver libraries into the container. The Kubernetes API stores none of this, it still shows "nvidia.com/gpu": "1" after the pod is running. This post traces that entire path on a minikube cluster with an RTX 3050.
What the Scheduler Sees
When you add nvidia.com/gpu: 1 to a pod spec, the scheduler evaluates the node’s reported GPU availability and binds the pod to a node that can satisfy the request. Here is what node capacity looks like on a minikube cluster with an RTX 3050:
kubectl get nodes -o json | jq '.items[].status.capacity'

{
  "cpu": "20",
  "ephemeral-storage": "949626612Ki",
  "hugepages-1Gi": "0",
  "hugepages-2Mi": "0",
  "memory": "32603084Ki",
  "nvidia.com/gpu": "1",
  "pods": "110"
}
At scheduling time, the GPU shows up as a countable resource in node status. The scheduler can treat nvidia.com/gpu: 1 as a quantity that must be available before placing the pod, similar to how it routes traffic to nodes based on their reported state. What it does not see are GPU UUIDs, device paths, or CUDA-level details.
Even after the pod is running, the Kubernetes API only stores the resource request:
kubectl get pod before-cuda-demo -o json | jq '.spec.containers[].resources'

{
  "limits": {
    "nvidia.com/gpu": "1"
  },
  "requests": {
    "nvidia.com/gpu": "1"
  }
}
So the scheduler places the pod on a suitable node, and from that point the actual device allocation happens somewhere else.
The Device Plugin Socket
That “somewhere else” is a Unix socket on the node. If you SSH into the minikube node and list the device plugin directory, you can see it:
minikube ssh -- sudo ls -la /var/lib/kubelet/device-plugins/

srwxr-xr-x 1 root root 0 Mar 21 14:49 kubelet.sock
srwxr-xr-x 1 root root 0 Mar 21 14:49 nvidia-gpu.sock
nvidia-gpu.sock is created by the NVIDIA device plugin, which runs as a DaemonSet on every GPU node in the cluster:
kubectl get pods -n kube-system | grep nvidia

nvidia-device-plugin-daemonset-b4fh7   1/1   Running   1 (5d ago)   6d
When this pod starts, it connects to kubelet.sock over gRPC and registers itself as the device plugin for nvidia.com/gpu on that node. You can see the exact moment this happens in the kubelet logs:
minikube ssh -- sudo journalctl -u kubelet | grep "Got registration request"

I0321 20:13:22.532584   77328 server.go:160] "Got registration request from device plugin with resource" resourceName="nvidia.com/gpu"
After registration, kubelet knows which plugin is responsible for nvidia.com/gpu on that node. The plugin then reports its devices through the device plugin API, and kubelet reflects that information in node status so the scheduler can use it.
The 5-Millisecond Allocation Path
Now that kubelet has a registered device plugin and knows where to find it, the next step happens when a pod that requests nvidia.com/gpu: 1 actually gets scheduled to the node. At that point, kubelet needs to turn the resource request into an actual device allocation, and it does this through a sequence of device-plugin gRPC calls over nvidia-gpu.sock.
These calls happen inside kubelet’s device manager and are only visible in the logs if you set kubelet verbosity to 4 or higher. At the default level of 0, the entire allocation sequence is silent. To enable it on minikube, you can update the kubelet config and restart:
minikube ssh -- "sudo sed -i 's/verbosity: 0/verbosity: 4/' /var/lib/kubelet/config.yaml && sudo systemctl restart kubelet"After restarting and deploying the GPU pod, you can filter the kubelet logs for the allocation-specific messages. The grep below matches the device manager log lines that cover the allocation calls and the checkpoint write that follows:
minikube ssh -- sudo journalctl -u kubelet | grep -E "Looking for needed|Need devices to allocate|GetPreferredAllocation|Making allocation request|Checkpoint file written" | grep -E "nvidia.com/gpu|kubelet_internal_checkpoint"

I0322 09:19:09.136353   53696 manager.go:835] "Looking for needed resources" resourceName="nvidia.com/gpu" pod="default/before-cuda-demo" containerName="cuda" needed=1
I0322 09:19:09.136380   53696 manager.go:600] "Need devices to allocate for pod" deviceNumber=1 resourceName="nvidia.com/gpu" podUID="f2b9f4e5-..." containerName="cuda"
I0322 09:19:09.136391   53696 manager.go:1018] "Issuing a GetPreferredAllocation call for container" resourceName="nvidia.com/gpu" containerName="cuda"
I0322 09:19:09.137452   53696 manager.go:881] "Making allocation request for device plugin" devices=["GPU-11ba558d-3437-2335-2fd8-a78c8502f87f"] resourceName="nvidia.com/gpu" pod="default/before-cuda-demo" containerName="cuda"
I0322 09:19:09.142098   53696 manager.go:502] "Checkpoint file written" checkpoint="kubelet_internal_checkpoint"
Five log lines, five steps. Read the timestamps: the first line lands at .136353, the last at .142098. The entire sequence took 5.74 milliseconds.
Walk through what happened in that window. The first two lines are kubelet’s device manager figuring out what the pod needs. It looks at the cuda container’s resource request, sees nvidia.com/gpu: 1, and concludes it needs one GPU device.
At .136391, kubelet asks the plugin a question: “which device would you prefer I allocate?” This is the GetPreferredAllocation call. The plugin answers about 1 millisecond later, with a GPU UUID: GPU-11ba558d-3437-2335-2fd8-a78c8502f87f.
This node has a single GPU, so the answer is obvious. On a node with four or eight GPUs the plugin would need to evaluate which devices are already taken, how the GPUs are connected to each other, and which CPU socket each one sits closest to. Here, there is only one candidate.
With a device selected, kubelet immediately sends an Allocate() call: “give me everything the container needs to use this GPU.” The plugin responds with environment variables, mount paths, device nodes, whatever the container runtime will need to wire the GPU into the container. By the last line, kubelet has written the result to a local checkpoint file, and the allocation is done.
You can inspect the checkpoint file to see the result of this allocation:
minikube ssh -- sudo cat /var/lib/kubelet/device-plugins/kubelet_internal_checkpoint

{
  "Data": {
    "PodDeviceEntries": [{
      "PodUID": "f2b9f4e5-ba3b-418e-ab8c-c1751a0619d8",
      "ContainerName": "cuda",
      "ResourceName": "nvidia.com/gpu",
      "DeviceIDs": { "-1": ["GPU-11ba558d-3437-2335-2fd8-a78c8502f87f"] },
      "AllocResp": "CkIKFk5WSURJQV9WSVNJQkxFX0RFVklDRVMSKEdQVS0xMWJhNTU4ZC0zNDM3LTIzMzUtMmZkOC1hNzhjODUwMmY4N2Y="
    }],
    "RegisteredDevices": {
      "nvidia.com/gpu": ["GPU-11ba558d-3437-2335-2fd8-a78c8502f87f"]
    }
  }
}
This checkpoint file is a node-local persistent record of which device IDs kubelet assigned to which pods and containers.
What Gets Injected Into the Container
Notice the AllocResp field in the checkpoint above. That base64 string is the serialized AllocateResponse protobuf that the device plugin returned to kubelet during the allocation. Decoding it shows what the plugin told kubelet to inject into the container:
echo "CkIKFk5WSURJQV9WSVNJQkxFX0RFVklDRVMSKEdQVS0xMWJhNTU4ZC0zNDM3LTIzMzUtMmZkOC1hNzhjODUwMmY4N2Y=" | base64 -d | strings

NVIDIA_VISIBLE_DEVICES
GPU-11ba558d-3437-2335-2fd8-a78c8502f87f
In this setup, the decoded allocation response shows a single environment variable: NVIDIA_VISIBLE_DEVICES set to the GPU UUID.
On this minikube cluster, the container runtime is Docker with nvidia set as the default runtime in /etc/docker/daemon.json:
minikube ssh -- cat /etc/docker/daemon.json

{
  "default-runtime": "nvidia",
  "runtimes": {
    "nvidia": {
      "path": "/usr/bin/nvidia-container-runtime"
    }
  }
}
In this minikube setup, kubelet passes the container configuration to Docker, and Docker starts the container through nvidia-container-runtime. The NVIDIA runtime reads NVIDIA_VISIBLE_DEVICES, resolves that UUID on the host, and makes the corresponding GPU device nodes and driver-related files available inside the container. If you are curious about how containers get their network interfaces through a similar injection pattern, see Pod Birth: veth Pairs, IPAM, and Container Networking.
To verify what actually got injected, you need to exec into a running container. The vectorAdd sample exits immediately after completing, so you cannot exec into it. A separate pod with the same image and GPU request, but with a sleep command, keeps the container alive for inspection:
cat <<EOF | kubectl apply -f -
apiVersion: v1
kind: Pod
metadata:
  name: gpu-inspect
spec:
  containers:
  - name: cuda
    image: nvcr.io/nvidia/k8s/cuda-sample:vectoradd-cuda11.7.1-ubuntu20.04
    command: ["sleep", "infinity"]
    resources:
      limits:
        nvidia.com/gpu: 1
EOF
Since this cluster has a single GPU, gpu-inspect will stay Pending until before-cuda-demo is deleted or completes and releases the GPU. The vectorAdd pod has already completed and released it, so gpu-inspect should schedule immediately.
Once the pod is running, you can list the NVIDIA device nodes inside the container:
kubectl exec gpu-inspect -- ls /dev/ | grep nvidia

nvidia-uvm
nvidia-uvm-tools
nvidia0
nvidiactl
These device nodes were not declared in the pod spec. In this setup, they were made available inside the container by the NVIDIA runtime integration on the node.
The environment variables tell the same story:
kubectl exec gpu-inspect -- env | grep NVIDIA

NVIDIA_VISIBLE_DEVICES=GPU-11ba558d-3437-2335-2fd8-a78c8502f87f
NVIDIA_REQUIRE_CUDA=cuda>=11.7 brand=tesla,driver>=450,driver<451 brand=tesla,driver>=470,driver<471 ...
NVIDIA_DRIVER_CAPABILITIES=compute,utility
NVIDIA_VISIBLE_DEVICES is the UUID we saw in the checkpoint. The other NVIDIA-related variables come from the image and the NVIDIA runtime stack involved in starting the container.
The NVIDIA runtime also makes the host’s driver binaries and libraries visible inside the container. You can see the full list of NVIDIA-related mount points:
kubectl exec gpu-inspect -- cat /proc/mounts | grep nvidia | awk '{print $2}'

/proc/driver/nvidia
/usr/bin/nvidia-smi
/usr/bin/nvidia-debugdump
/usr/bin/nvidia-persistenced
/usr/lib/x86_64-linux-gnu/libnvidia-ml.so.550.163.01
/usr/lib/x86_64-linux-gnu/libnvidia-cfg.so.550.163.01
/usr/lib/x86_64-linux-gnu/libnvidia-gpucomp.so.550.163.01
/usr/lib/x86_64-linux-gnu/libnvidia-ptxjitcompiler.so.550.163.01
/usr/lib/x86_64-linux-gnu/libnvidia-allocator.so.550.163.01
/usr/lib/x86_64-linux-gnu/libnvidia-pkcs11-openssl3.so.550.163.01
/usr/lib/firmware/nvidia/550.163.01/gsp_ga10x.bin
/usr/lib/firmware/nvidia/550.163.01/gsp_tu10x.bin
/dev/nvidiactl
/dev/nvidia-uvm
/dev/nvidia-uvm-tools
/dev/nvidia0
/proc/driver/nvidia/gpus/0000:01:00.0
In this container, you can see 17 NVIDIA-related mount points. They include host-provided driver binaries, shared libraries, firmware blobs, device nodes, and proc entries made visible inside the container. By the time your CUDA code calls cudaGetDeviceCount(), everything it needs is already in place.
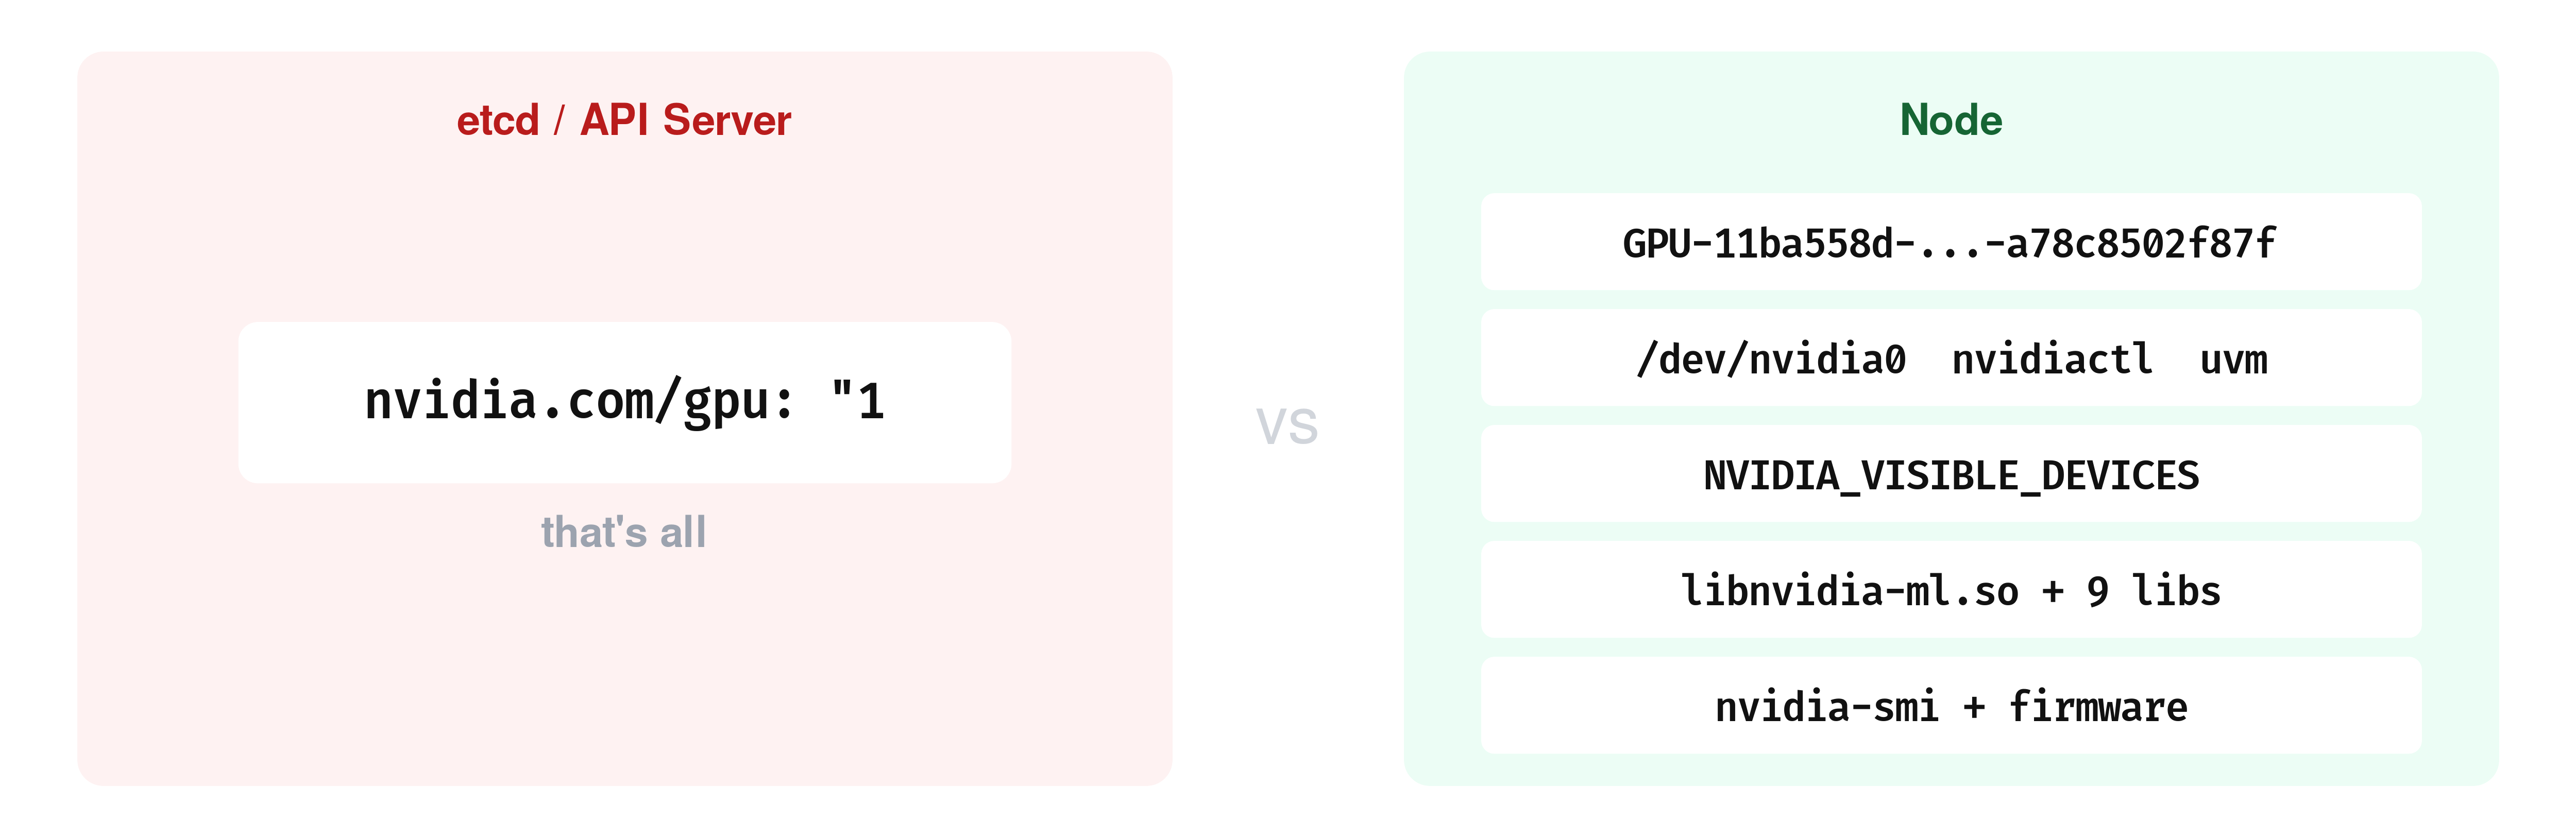
After all of this, the Kubernetes API still returns the same output we saw at the beginning of this post: "nvidia.com/gpu": "1".
And if you need to know which physical GPU is backing a workload, the Kubernetes API does not expose that mapping directly.
The main Kubernetes-native places to inspect that mapping on the node are the kubelet checkpoint file at /var/lib/kubelet/device-plugins/kubelet_internal_checkpoint and the kubelet PodResources gRPC API at /var/lib/kubelet/pod-resources/kubelet.sock.
Topology Manager and NUMA Considerations
Till now, we assumed one GPU and one allocation. But on a multi-GPU server, kubelet has a harder question to answer: which GPU should this container get?
Part of that answer involves NUMA topology. A modern server can have two or more CPU sockets, each with its own memory and its own set of PCIe slots. A GPU sitting in a PCIe slot is physically closer to one CPU socket than the other. When a container’s process runs on a CPU core that is on the same socket as its GPU, data moves directly. When it runs on a core from the other socket, every transfer between host memory and GPU memory has to cross the socket interconnect.
And that adds latency.
Kubelet has a component called the Topology Manager that tries to prevent this mismatch.
When a pod requests both CPU and GPU resources, the Topology Manager asks the device plugin and the CPU manager which NUMA node each resource sits on. If they are on the same node, the pod is admitted. If they are not, the outcome depends on the policy.
You can see which policy kubelet is running on this node:
minikube ssh -- sudo journalctl -u kubelet | grep "topology_manager"

I0328 11:59:24.728974   1952 topology_manager.go:138] "Creating topology manager with none policy"
none means kubelet does not even check.
On this node, there is only one NUMA node:
minikube ssh -- ls /sys/devices/system/node/

has_cpu  has_generic_initiator  has_memory  has_normal_memory  node0  online  possible  power  uevent
Only node0. The GPU’s PCI device reports -1 for its NUMA affinity, which means the system does not distinguish between sockets for this device:
minikube ssh -- cat /sys/bus/pci/devices/0000:01:00.0/numa_node

-1
So on this node, the Topology Manager has nothing to enforce. On a multi-socket server with GPUs spread across two NUMA nodes, the policy choice determines whether the CPU cores serving your container sit on the same socket as the GPU they are feeding data to. If you get that wrong, every host-to-device memory transfer crosses the socket interconnect instead of staying local. This adds latency to data loading, and no Kubernetes-level metric reports it.
MIG and GPU Sharing
So far, every Allocate() call in this post handed a whole physical GPU to one container. That works when you have one GPU and one workload. But an A100 has 80 GB of memory and thousands of CUDA cores, if your container only needs 5 GB and a few hundred cores, the rest sits idle. Two mechanisms exist to split a GPU between containers.
You can check whether this GPU supports partitioning:
minikube ssh -- nvidia-smi -i 0 --query-gpu=mig.mode.current --format=csv,noheader

[N/A]
N/A means this GPU does not support it.
Multi-Instance GPU (MIG) is available on NVIDIA data center GPUs with compute capability 8.0 and above ( which includes the A30, A100, H100, H200, and the Blackwell generation (B200, GB200)). It partitions a single physical GPU into up to seven isolated instances, each with its own compute units, memory, and memory bandwidth.
When MIG is enabled, the device plugin stops advertising nvidia.com/gpu and starts advertising resources like nvidia.com/mig-1g.5gb, nvidia.com/mig-3g.40gb.
Each MIG instance appears as a separate device in the plugin’s ListAndWatch response and goes through the same Allocate() path, but the UUID refers to a MIG slice rather than a full GPU.
You can also check what GPU sharing resources the device plugin is currently advertising on this node:
kubectl get node -o json | jq '.items[0].status.capacity | to_entries[] | select(.key | startswith("nvidia"))'

{
  "key": "nvidia.com/gpu",
  "value": "1"
}
We see only nvidia.com/gpu: 1.
But the NVIDIA device plugin also supports time-slicing, and unlike MIG, this GPU can do it.
Time-slicing makes a single physical GPU appear as multiple devices by advertising it with a higher replica count.
To see it in action, you can reconfigure the device plugin with a ConfigMap that sets three replicas per GPU:
cat <<'EOF' | kubectl apply -f -
apiVersion: v1
kind: ConfigMap
metadata:
  name: time-slicing-config
  namespace: kube-system
data:
  any: |-
    version: v1
    sharing:
      timeSlicing:
        resources:
        - name: nvidia.com/gpu
          replicas: 3
EOF

configmap/time-slicing-config created
Now let’s redeploy the device plugin with this config mounted as a volume:
kubectl delete daemonset nvidia-device-plugin-daemonset -n kube-system

cat <<'EOF' | kubectl apply -f -
apiVersion: apps/v1
kind: DaemonSet
metadata:
  name: nvidia-device-plugin-daemonset
  namespace: kube-system
spec:
  selector:
    matchLabels:
      name: nvidia-device-plugin-ds
  template:
    metadata:
      labels:
        name: nvidia-device-plugin-ds
    spec:
      tolerations:
      - key: nvidia.com/gpu
        operator: Exists
        effect: NoSchedule
      priorityClassName: system-node-critical
      containers:
      - image: nvcr.io/nvidia/k8s-device-plugin:v0.17.0
        name: nvidia-device-plugin-ctr
        env:
        - name: CONFIG_FILE
          value: /config/any
        securityContext:
          allowPrivilegeEscalation: false
          capabilities:
            drop: ["ALL"]
        volumeMounts:
        - name: device-plugin
          mountPath: /var/lib/kubelet/device-plugins
        - name: config
          mountPath: /config
      volumes:
      - name: device-plugin
        hostPath:
          path: /var/lib/kubelet/device-plugins
      - name: config
        configMap:
          name: time-slicing-config
EOF
The key difference from the default DaemonSet is the CONFIG_FILE environment variable pointing to /config/any, and the ConfigMap mounted at /config. Once the plugin pod is running, the node’s reported capacity changes:
kubectl get nodes -o json | jq '.items[0].status.capacity["nvidia.com/gpu"]'

"3"
One physical GPU, three advertised replicas. You can now schedule three pods that each request nvidia.com/gpu: 1:
for i in 1 2 3; do
cat <<EOF | kubectl apply -f -
apiVersion: v1
kind: Pod
metadata:
  name: ts-pod-$i
spec:
  containers:
  - name: cuda
    image: nvcr.io/nvidia/k8s/cuda-sample:vectoradd-cuda11.7.1-ubuntu20.04
    command: ["sleep", "infinity"]
    resources:
      limits:
        nvidia.com/gpu: 1
EOF
done

pod/ts-pod-1 created
pod/ts-pod-2 created
pod/ts-pod-3 created
All three pods run at the same time on a node that has a single GPU. Check what UUID each one sees:
for i in 1 2 3; do
  echo "ts-pod-$i: $(kubectl exec ts-pod-$i -- printenv NVIDIA_VISIBLE_DEVICES)"
done

ts-pod-1: GPU-11ba558d-3437-2335-2fd8-a78c8502f87f
ts-pod-2: GPU-11ba558d-3437-2335-2fd8-a78c8502f87f
ts-pod-3: GPU-11ba558d-3437-2335-2fd8-a78c8502f87f
All three Allocate() calls returned the same GPU UUID: three containers, one device, no boundaries between them. Before time-slicing, this node could run exactly one GPU pod, and now it runs three.
The cost is that all three containers see the same physical GPU with no isolation between them. If one container allocates most of the GPU memory, the others will fail when they try to allocate theirs.
So, time-slicing does not partition anything. It just removes the one-container-per-GPU scheduling constraint and it gives you more pods at the risk of contention. Deciding which mechanism to use, and how much GPU to actually give each workload, is a deeper problem. If you want to go deeper, check this free guide on right-sizing GPUs in Kubernetes sponsored by Kubex. We’ve tried to cover the observability signals and trade-offs involved.
MIG does the opposite trade-off: fewer slices, but each one has its own isolated memory and compute. We just saw that with time-slicing, three Allocate() calls all returned the same GPU UUID, three containers, one device, no boundaries between them. With MIG, each Allocate() call returns a different UUID pointing to a separate hardware partition with its own memory.
Before continuing, clean up the time-slicing setup and restore the default device plugin:
kubectl delete pod ts-pod-1 ts-pod-2 ts-pod-3
kubectl delete daemonset nvidia-device-plugin-daemonset -n kube-system
kubectl delete configmap time-slicing-config -n kube-system
kubectl create -f https://raw.githubusercontent.com/NVIDIA/k8s-device-plugin/v0.17.0/deployments/static/nvidia-device-plugin.yml
Wait for the plugin pod to come back and verify the node reports one GPU again:
kubectl get nodes -o json | jq '.items[0].status.capacity["nvidia.com/gpu"]'

"1"
What Happens When Things Break
Everything so far has been the happy path. The device plugin is running, kubelet can reach it, and allocations succeed.
But what happens when that breaks?
kubectl get pods -n kube-system | grep nvidia

nvidia-device-plugin-daemonset-bnmkq   1/1   Running   1 (5d ago)   6d

kubectl delete pod nvidia-device-plugin-daemonset-bnmkq -n kube-system

pod "nvidia-device-plugin-daemonset-b4fh7" deleted
The DaemonSet controller immediately creates a replacement pod. You can watch kubelet detect the socket disconnection and then the re-registration:
minikube ssh -- sudo journalctl -u kubelet --since "1 min ago" | grep -E "Removed device plugin|Got registration request"
W0322 10:05:41.218903 53696 manager.go:312] "Removed device plugin for resource" resourceName="nvidia.com/gpu"
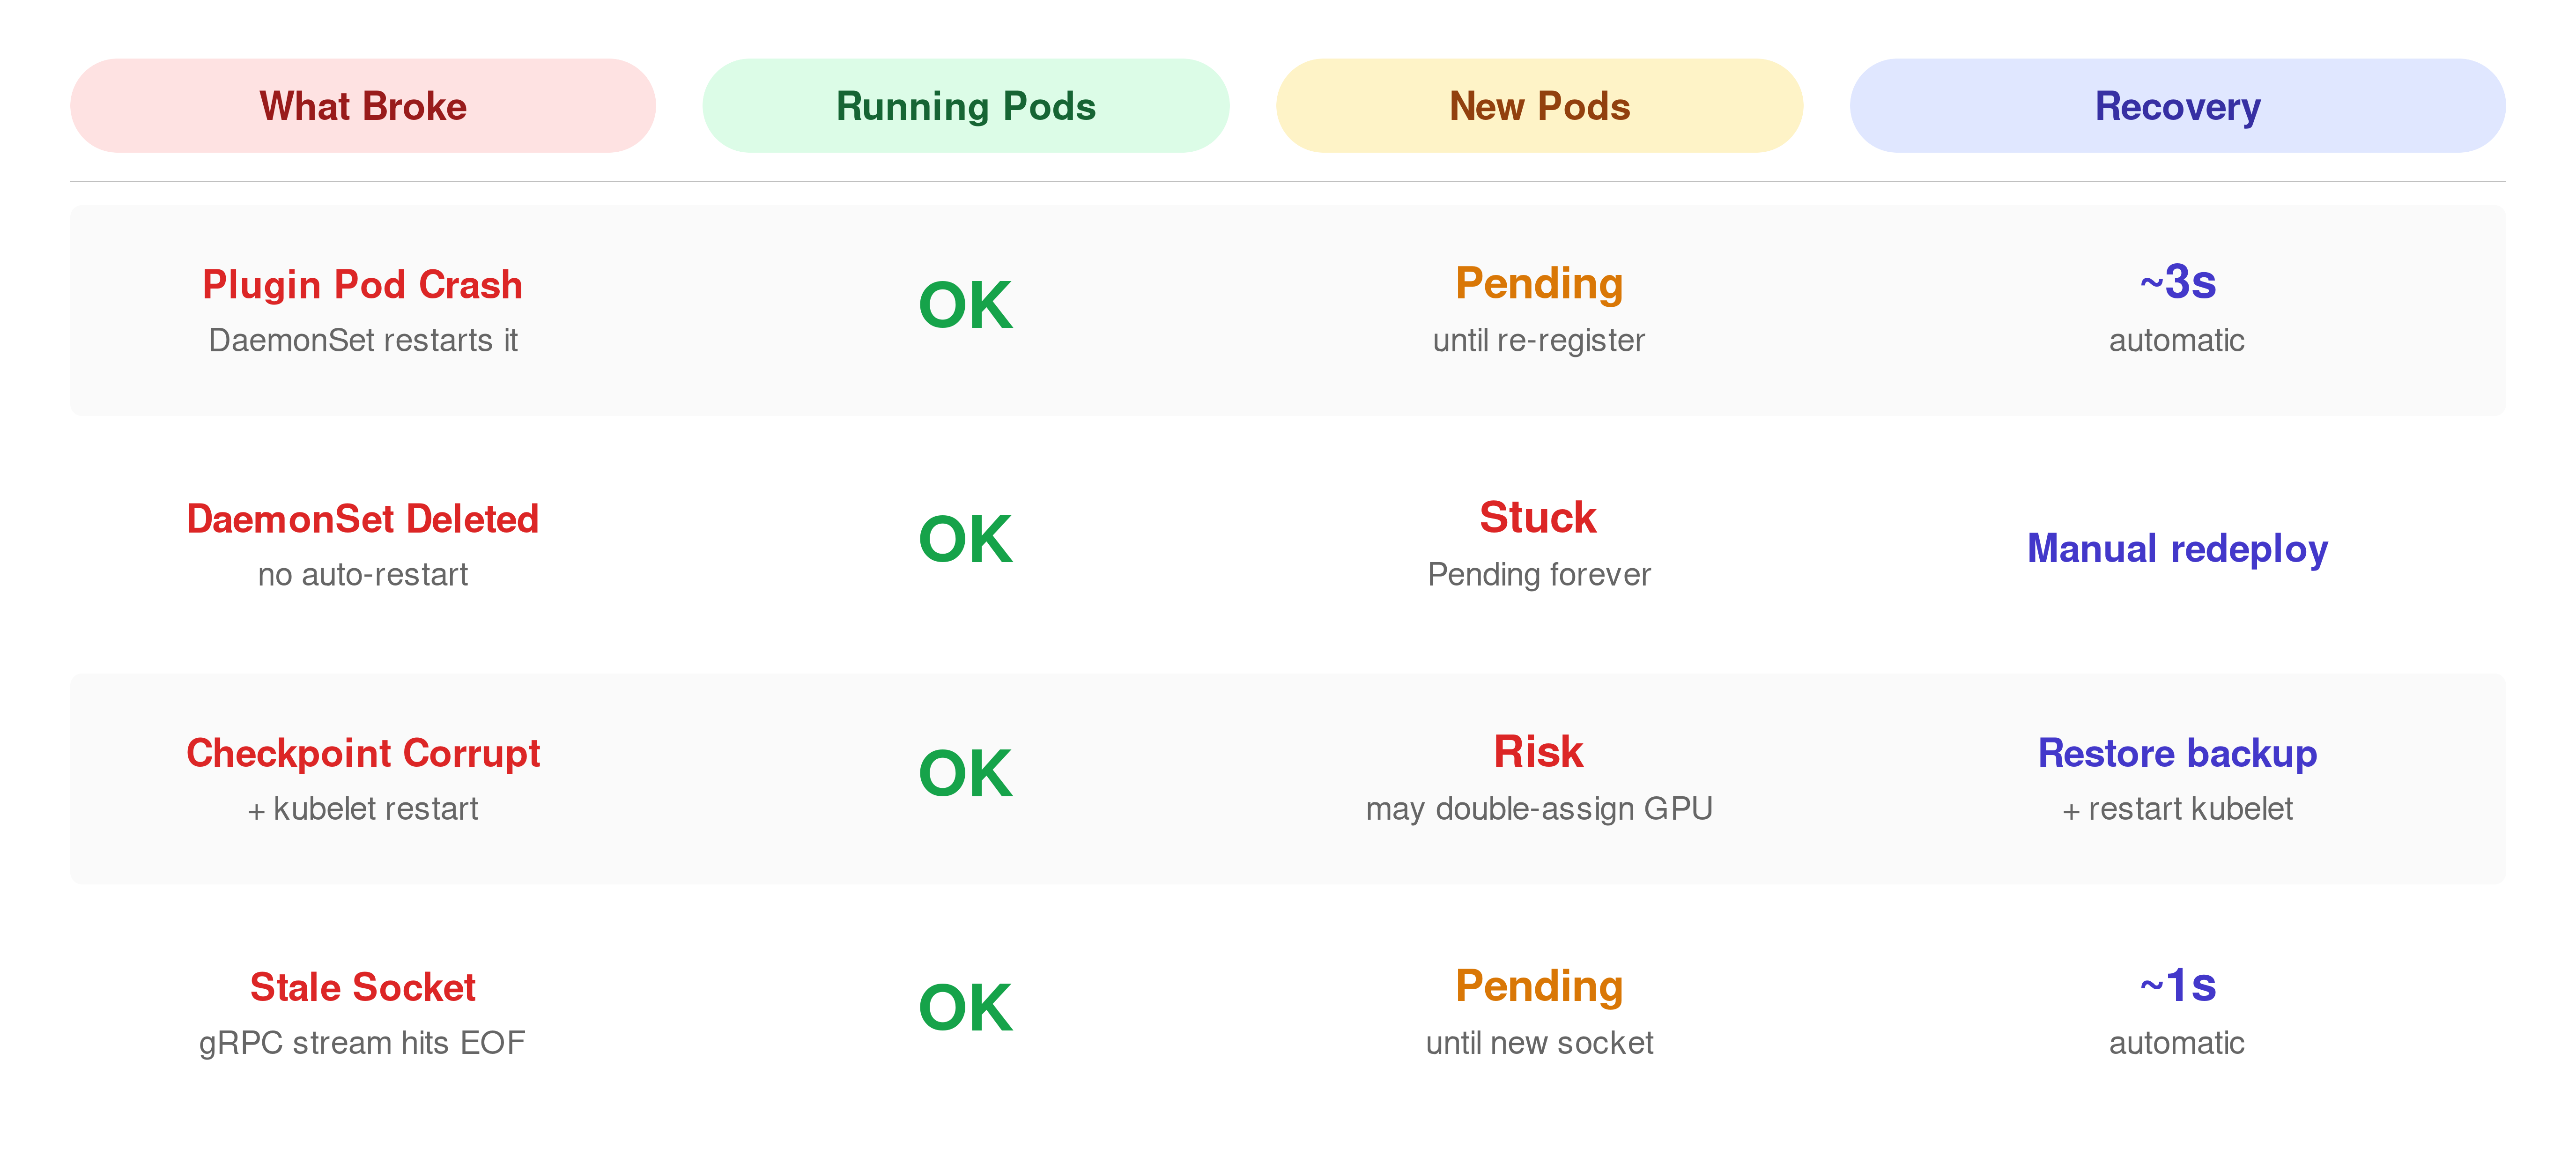
I0322 10:05:43.894122 53696 server.go:160] "Got registration request from device plugin with resource" resourceName="nvidia.com/gpu"About 2.7 seconds between removal and re-registration. Most of that time is Kubernetes housekeeping: the DaemonSet controller noticing the pod is gone, scheduling a replacement, and starting the container. The container image was already cached on this node, so there was no pull delay.
The plugin itself registers in under a second once it is running. On a production node under load, this gap can be wider. If the initial registration handshake fails, kubelet used to wait at least 30 seconds before retrying (#127457). That was fixed and merged into master in January 2026.
What happens to pods that were already using the GPU during those 2.7 seconds?
Let’s deploy a gpu pod, then delete the plugin while the pod is running:
kubectl exec gpu-inspect -- ls /dev/nvidia0
/dev/nvidia0

kubectl delete -n kube-system $(kubectl get pods -n kube-system -l name=nvidia-device-plugin-ds -o name | head -1) --force
The plugin is gone. Check the GPU pod again:
kubectl exec gpu-inspect -- ls /dev/nvidia0

/dev/nvidia0
Still there.
The device nodes and driver mounts were injected into the container at startup. The plugin is only needed when kubelet wants to allocate a new GPU.
To see that side of it, delete the entire DaemonSet so no replacement pod comes back, and check what the node reports:
kubectl delete daemonset nvidia-device-plugin-daemonset -n kube-system

kubectl get nodes -o json | jq '.items[0].status.allocatable["nvidia.com/gpu"]'

"0"
Allocatable dropped to zero. Now try to schedule a new GPU pod:
kubectl get pod gpu-pending-test

NAME               READY   STATUS    RESTARTS   AGE
gpu-pending-test   0/1     Pending   0          9s
The scheduler sees zero allocatable GPUs and has nowhere to place it. If we redeploy the device plugin, we’ll see the pod starts running within seconds.
What if kubelet itself restarts, not just the plugin?
That is what the checkpoint file is for. Kubelet reads /var/lib/kubelet/device-plugins/kubelet_internal_checkpoint on startup to rebuild its device-to-pod map before any plugin registers. Kubelet uses a similar file-based mechanism for atomic ConfigMap updates, local state on disk that survives restarts.
Let’s back it up, write garbage to it, and restart kubelet:
minikube ssh -- "sudo cp /var/lib/kubelet/device-plugins/kubelet_internal_checkpoint /var/lib/kubelet/device-plugins/kubelet_internal_checkpoint.bak"
minikube ssh -- "echo 'CORRUPTED' | sudo tee /var/lib/kubelet/device-plugins/kubelet_internal_checkpoint"
minikube ssh -- "sudo systemctl restart kubelet"
Check the kubelet logs:
minikube ssh -- sudo journalctl -u kubelet --since "30 sec ago" | grep -i checkpoint

E0328 20:53:56.625089  118745 manager.go:347] "Continue after failing to read checkpoint file. Device allocation info may NOT be up-to-date" err="invalid character 'C' looking for beginning of value"
Kubelet found the corrupted file, could not parse it, and continued without any device allocation history. Running pods still have their GPU mounts, those are already in the container. But kubelet no longer knows which devices are assigned to which pods. On a multi-GPU node, this means kubelet could allocate an already-in-use GPU to a new pod. On this single-GPU node we cannot test this, but the log message makes it clear that kubelet is operating without its allocation map.
Restore the backup before continuing:
minikube ssh -- "sudo cp /var/lib/kubelet/device-plugins/kubelet_internal_checkpoint.bak /var/lib/kubelet/device-plugins/kubelet_internal_checkpoint"
minikube ssh -- "sudo systemctl restart kubelet"
One more thing to watch: stale sockets. Delete the plugin pod:
kubectl delete -n kube-system $(kubectl get pods -n kube-system -l name=nvidia-device-plugin-ds -o name | head -1)

pod "nvidia-device-plugin-daemonset-gvczz" deleted
Then immediately check what kubelet logged:
minikube ssh -- "sudo journalctl -u kubelet --since '30 sec ago' | grep -E 'ListAndWatch ended|Got registration'"

E0328 20:59:23.736830  118883 client.go:90] "ListAndWatch ended unexpectedly for device plugin" err="rpc error: code = Unavailable desc = error reading from server: EOF" resource="nvidia.com/gpu"
I0328 20:59:24.920559  118883 server.go:160] "Got registration request from device plugin with resource" resourceName="nvidia.com/gpu"
The first line is kubelet discovering that its gRPC stream to the old socket hit EOF. So, the plugin on the other end is gone.
About one second later, the replacement plugin pod has started, created a fresh nvidia-gpu.sock, and registered with kubelet.
You can verify that the socket was actually replaced by checking its timestamp before and after. Before deleting the plugin pod:
minikube ssh -- "sudo stat -c '%Y %n' /var/lib/kubelet/device-plugins/nvidia-gpu.sock"

1774731875 /var/lib/kubelet/device-plugins/nvidia-gpu.sock
After deleting the plugin pod and waiting a few seconds:
minikube ssh -- "sudo stat -c '%Y %n' /var/lib/kubelet/device-plugins/nvidia-gpu.sock"

1774731959 /var/lib/kubelet/device-plugins/nvidia-gpu.sock
Different timestamps.
The old socket was removed and a new one was created. Kubernetes device plugin documentation states that a new kubelet instance deletes all existing Unix sockets under /var/lib/kubelet/device-plugins/ when it starts, and that a device plugin is expected to monitor socket deletion and re-register itself. The NVIDIA device plugin follows this pattern by removing its own socket on startup before creating a fresh one.
All of the failure modes above, plugin crash, checkpoint corruption, stale sockets, play out entirely on the node. The API server never knew which physical GPU was assigned. It still just stores "nvidia.com/gpu": "1".
Why the API Server Does Not Track Device Assignments
Think about what happened during the allocation we traced earlier. Kubelet talked to the plugin over a local Unix socket, got a GPU UUID back, and wrote it to a checkpoint file on disk. The whole thing took 5.74 milliseconds and never left the node.
That is a deliberate design choice. The allocation runs inside kubelet’s admit loop, which blocks pod startup until it completes. If kubelet also had to send the device assignment to the API server and wait for etcd to confirm the write, that would add a network round-trip and a disk sync on the etcd cluster to every single GPU pod admission. Every other Kubernetes object update, pod status changes, endpoint updates, lease renewals, goes through etcd. Adding per-device writes for every container would increase the load on a component that is already the bottleneck in large clusters.
So Kubernetes keeps device assignments local to the node. We’ve already seen the trade-off by asking the API: which GPU does gpu-inspect have. And it answered just a count: “nvidia.com/gpu”: “1”.
Now ask the node through the checkpoint file, using the pod’s UID:
POD_UID=$(kubectl get pod gpu-inspect -o jsonpath='{.metadata.uid}')

minikube ssh -- "sudo cat /var/lib/kubelet/device-plugins/kubelet_internal_checkpoint" \
  | jq --arg uid "$POD_UID" '.Data.PodDeviceEntries[] | select(.PodUID==$uid) | {PodUID, DeviceIDs, ResourceName}'

{
  "PodUID": "60921126-5b78-4e9b-867f-371ba9a65349",
  "DeviceIDs": {
    "-1": [
      "GPU-11ba558d-3437-2335-2fd8-a78c8502f87f"
    ]
  },
  "ResourceName": "nvidia.com/gpu"
}
The actual GPU UUID. The API does not have it, the node does.
Kubelet also exposes this same mapping through the PodResources gRPC API. You can query it with grpcurl and the kubelet PodResources proto definition:
minikube ssh -- "sudo grpcurl -plaintext -unix \
  -import-path /tmp -proto api.proto \
  /var/lib/kubelet/pod-resources/kubelet.sock v1.PodResourcesLister/List" \
  | jq '.podResources[] | select(.name=="gpu-inspect") | .containers[0].devices'

[
  {
    "resourceName": "nvidia.com/gpu",
    "deviceIds": [
      "GPU-11ba558d-3437-2335-2fd8-a78c8502f87f"
    ]
  }
]
Same UUID in every case. The checkpoint file, the PodResources API, the container itself has it in NVIDIA_VISIBLE_DEVICES.
The device plugin model works, but it has a limitation we keep running into: everything about the actual GPU assignment lives on the node. The scheduler only sees a number. It cannot say “give this pod a GPU with at least 40 GB of memory” or “put these two pods on GPUs that are connected by NVLink.” It can only count how many GPUs are free.
Where This Is Heading: Dynamic Resource Allocation
Dynamic Resource Allocation (DRA) is Kubernetes’ answer to that. You can check whether the DRA API objects exist on this cluster:
kubectl api-resources | grep -i resourceclaim

resourceclaims                                   resource.k8s.io/v1                true         ResourceClaim
resourceclaimtemplates                           resource.k8s.io/v1                true         ResourceClaimTemplate
With DRA, instead of requesting nvidia.com/gpu: 1 and hoping for the best, a pod creates a ResourceClaim that describes what kind of device it needs, for example, “one GPU with at least 10 GB of memory from this device class.”
The scheduler reads that claim, talks to a DRA driver that knows the actual hardware on each node, and picks a node where a matching device is available. The device selection happens at scheduling time, not after the pod is already placed.
DRA also solves the visibility problem we just demonstrated. With device plugins, the GPU assignment lives in a node-local checkpoint file and never reaches the API. With DRA, the allocation result is stored in the ResourceClaim object. The Kubernetes DRA tutorial shows what that looks like: after a pod is scheduled, kubectl get resourceclaim -o yaml includes a status.allocation.devices.results field that contains the specific device name, the driver, and the node it was allocated on.
DRA graduated to GA in Kubernetes 1.34 (August 2025). The resource.k8s.io/v1 API on this cluster is the stable version.
The device plugin API is not deprecated, and the allocation path we traced in this post, GetPreferredAllocation, Allocate(), checkpoint file, is still how the NVIDIA device plugin works today.
But we also tried to show where that path falls short.
We had to SSH into the node to find the GPU UUID, read a checkpoint file to understand the allocation, query a gRPC API. DRA makes that information a regular Kubernetes object.
NVIDIA is already moving in that direction.
In March 2026 they donated their DRA driver for GPUs to the CNCF. For new clusters and new device integrations, DRA is where this is heading.
Key Takeaways
- In Kubernetes, a GPU request such as nvidia.com/gpu: 1 helps the scheduler find a node with available GPU capacity, but it does not decide which exact physical GPU the workload will receive. That decision is made later on the chosen node, where kubelet works with the NVIDIA device plugin to turn a generic resource request into a concrete device assignment.
- The actual GPU-to-pod mapping is not stored in the Kubernetes API, so even after the pod is running, kubectl still shows only the original resource request rather than the physical device that was assigned. To find the real GPU behind a workload, you have to inspect node-local sources such as kubelet’s checkpoint data, the PodResources API, or the environment exposed inside the container.
- When a GPU workload starts, kubelet contacts the device plugin over a Unix socket, asks it to choose a suitable device, and receives the information needed to prepare the container for GPU access. The NVIDIA runtime then uses that allocation result to expose the right device nodes, driver libraries, and related runtime components inside the container, so CUDA applications can run without declaring those low-level details in the pod spec.
- Kubernetes supports more than one way to share GPU capacity, but each approach comes with a different tradeoff. Time-slicing allows multiple pods to use the same physical GPU at the same time without hard isolation, while MIG on supported NVIDIA data center GPUs creates separate hardware-backed slices with their own dedicated memory and compute resources.
- Dynamic Resource Allocation shows where Kubernetes GPU management is heading, because it moves device selection closer to scheduling time and makes the allocation result visible through standard Kubernetes objects. That is a meaningful shift from the current device plugin model, where the most important details about the assigned GPU remain hidden on the node rather than being visible through the API.
If you are building a platform where multiple teams share GPU nodes, the isolation and multi-tenancy questions go well beyond what we covered here. Daniele and Saiyam has put together an ebook on GPU-enabled platforms on Kubernetes sponsored by vCluster that digs into those architectural decisions.
If you want to understand all of this but aren’t sure where to start, Daniele has an excellent talk that makes the whole GPU-on-Kubernetes story click: GPU Sharing on Kubernetes. We also gave a KubeCon EU 2026 talk that walks through the same allocation path live on a cluster. The recording should be up soon.
References
- Kubernetes Device Plugins
- Schedule GPUs
- NVIDIA k8s-device-plugin
- NVIDIA Container Toolkit
- Topology Manager
- NVIDIA MIG User Guide
- NVIDIA GPU Sharing with Time-Slicing
- Dynamic Resource Allocation
- KEP-3573: Device Plugin API
- Right-Sizing GPUs in Kubernetes, Kubex eBook
- GPU-Enabled Platforms on Kubernetes: vCluster ebook
- GPU Sharing on Kubernetes, Daniele Polencic (YouTube)
- GPUs on Kubernetes: What Actually Happens When You Request nvidia.com/gpu: 1, KubeCon EU 2026